
Dr. Fabio Pacifici and Dr. Kumar Navulur
DigitalGlobe, Inc.
The last decade has seen an increased use of satellite imagery for a variety of urban applications, including mapping of land records, extraction of urban forest canopy, and estimation of impervious surfaces for storm water taxation. DigitalGlobe is a commercial satellite imagery company, headquartered in Longmont, Colo., that has three optical very high spatial resolution satellites: QuickBird, WorldView-1, and the latest WorldView-2.

Figure 1: Comparison of QuickBird, WorldView-1, and WorldView-2 spectral bands.
Launched in 2009, WorldView-2 is the first commercial satellite to carry a very high spatial resolution sensor with one panchromatic and eight multi-spectral bands (C=Coastal, B=Blue, G=Green, Y=Yellow, R=Red, RE=Red Edge, N1=Near-Infrared1, and N2=Near-Infrared2, with center wavelengths at 425, 480, 545, 605, 660, 725, 835, and 950 nm, respectively). By comparison, QuickBird four spectral bands (B, G, R, N1) are centered at 485, 560, 660 and 830 nm, as shown in Figure 1.

Figure 2: Octavio Bridge, Sao Paulo, Brazil with Worldview-2 Sensor at 0.5 meter spatial resolution.

Table 1: WorldView-2 Design and Specifications.
The new spectral bands have been designed to support vegetation and coastal analysis, with applications in plant species identification, mapping of vegetation stress and crop types, mapping of benthic habitats, wetlands, coast water quality, and bathymetry [1]. Overall, the broader and continuous coverage, along with sharper multispectral channels, provide the potential for more robust modeling and discrimination of spectral signatures, resulting in more accurate feature extraction and land cover classification.

Figure 3: Parcels digitized from DigitalGlobe Imagery.
Specifically, the C band has proven to be particularly useful for the retrieval of water depth, true-color correction for human vision representation, chlorophyll absorption, and atmospheric scattering correction [2]. The new RE and Y bands are uniquely positioned to capture vegetation phenomenology. The red edge marks the transition between the visible spectral region, where plant pigments absorb most of the incident energy, and the near-infrared, where reflectance is high from plant canopies. Its position shifts according to changes of chlorophyll content, leaf area index, biomass, age, plant type, species, health levels and seasonal patterns. Similarly, an increase in reflectance in the wavelengths between 575 and 600 nm (Y) can be diagnostic of a decrease in leaf chlorophyll and vegetation stress. The Yellow band also can assist the true-color correction for human vision representation. The N2 band overlaps and extends the dynamic range of the spectrum, providing more discriminatory power for vegetation analysis, materials differentiation and biomass studies [3].

Figure 4: Detailed 3D model using DigitalGlobe imagery.
Figure 2 shows the details that can be captured from WorldView-2, such as road markings and the cables on the bridge.
WorldView-1 and WorldView-2 have a high-performance camera control system capable of rapid retargeting and high off-nadir imagery collection. This allows the satellite to collect a multi-angle image sequence of a single target, accumulated over a short period of time from a large variety of observation angles. Detailed WorldView-2 design and specifications can be found in Table 1.
DigitalGlobe imagery provides value in understanding the Earth and the impacts of man-made activities and natural processes. For example, the high accuracy imagery can be used for detailed land inventory including planimetric maps, land parcel maps, zoning maps, etc. Figure 3 shows an example of cadastral maps extracted from DigitalGlobe imagery.
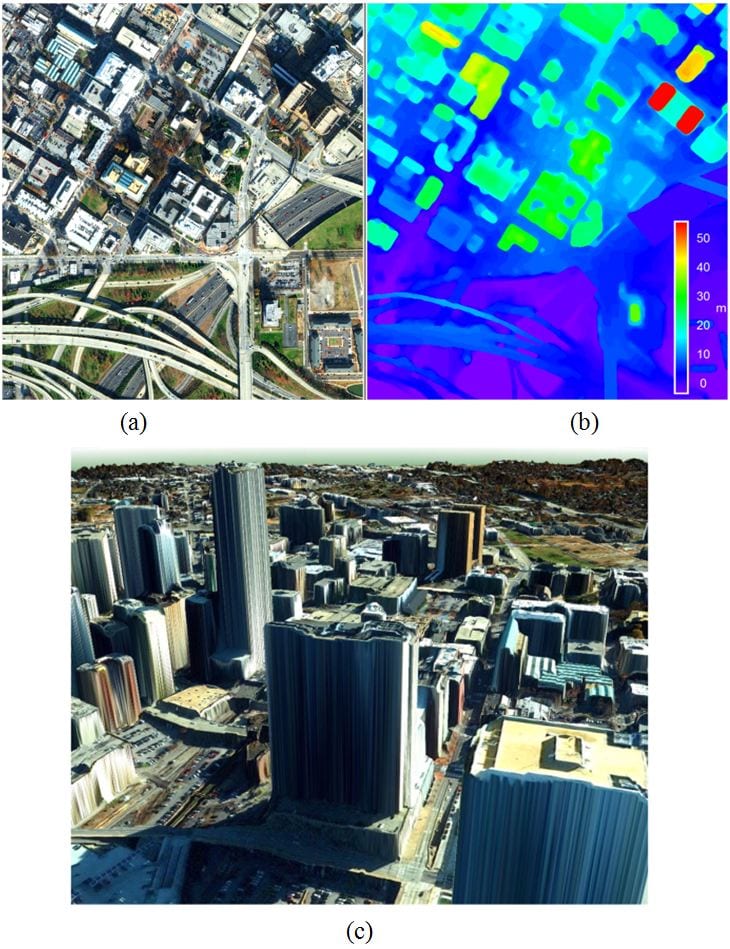
Figure 5: Detail of downtown Atlanta (a) with the corresponding digital height map (b), and its 3D visualization (c).

Figure 6: Downtown Atlanta (a) and 15 classes map (b).
DigitalGlobe satellites are designed to collect imagery from anywhere across the globe. The Worldview satellites are very agile and can collect imagery within 24 hours (barring clouds). Coupled with agility, accuracy, and revisit, the satellites are designed to collect stereo or multi-angle imagery that allows users to create detailed 3D models of cities as illustrated in Figures 4 and 5. In particular, the pixel height information, also known as digital height map (DHM), can be derived by removing the digital elevation model from the surface model, both computed as a measure of spatial correlation and the known satellite observation angles of the stereo or multi-angle images.

Figure 7: Normalized feature contribution grouped by data type.
DigitalGlobe satellites can be used to extract detailed land-use/land-cover maps suitable for urban planning. In Figure 6, 15 classes of interest are extracted, representing a wide variety of natural and man-made land covers, including bridges, parking lots, vehicles, and skyscrapers.
The classification map was obtained by exploiting the unique aspects of WorldView-2 and combining very high spatial and multi-spectral resolution with multi-angle observations. Specifically, three data sets of spatial measurements were used in addition to the multi-spectral information. These three data sets were measurements of texture, morphology, and height. The texture data set was created using six second-order textural parameters calculated using the panchromatic band. The six texture parameters were: Homogeneity, contrast, dissimilarity, entropy, second moment, and correlation. The morphological data set was created with opening and closing by reconstruction [4].
Figure 7 shows the so-called feature contribution grouped per data type, which is a measure of input importance per single class. The feature contribution is determined by the information gain ratio [4]. As shown, many of the spectral, textural, and morphological inputs provide significant contribution. But the height information contributes most significantly to the overall classification — and skyscraper, building, residential home, and bridge classes are most affected by it.

Figure 8: Before (a) and after (b) image over Beijing and the corresponding Worldview-1 change detection map (c).
Generally speaking, the inclusion of the DHM increases the ability to differentiate objects with significant height compared to other spectrally similar classes, such as bridges and highways, buildings and skyscrapers, as well as trees and ground level vegetation. On the other hand, the DHM does not introduce much information for the discrimination of the different vegetation covers. For example, the RE and the 2 N channels contain more information than other spatial features.
Finally, satellite revisit allows for frequent monitoring and mapping changes of urban landscapes. Figure 8 shows an example of changes detected using the WorldView-1 satellite over Beijing. The change map can be easily obtained as a comparison between the two acquisitions. A common approach is called image differencing, which consists in simply subtracting the two images [5]. Then, a threshold can be manually or automatically set to highlight only the most important changes.
Fabio Pacifici received the Ph.D. degree in GeoInformation from Tor Vergata University, Rome, Italy, in 2010. He also received the Laurea Specialistica (M.S.; cum laude) and Laurea (B.S.; cum laude) degrees in telecommunication engineering from the the same University, in 2003 and 2006, respectively. Since 2009, he has been working at DigitalGlobe as R&D Scientist.
References
[1] Kumar Navulur, ÛÏThe Benefits of the 8 Spectral Bands of WorldView-2: white paper,Û available at: www.digitalglobe.com/ [2] G. Marchisio, F. Pacifici, and C. Padwick, ÛÏCoastal applications of WorldView-2 high resolution multi-spectral imagery,Û American Society for Photogrammetry and Remote Sensing 2011 Annual Conference, Milwaukee, USA, May 1-5, 2011 [3] G. Marchisio, F. Pacifici, and C. Padwick, ÛÏEvidence of improved vegetation discrimination and urban mapping using WorldView-2 high resolution multi-spectral imagery,Û American Society for Photogrammetry and Remote Sensing 2011 Annual Conference, Milwaukee, USA, May 1-5, 2011 [4] N. Longbotham, C. Bleiler, C. Chaapel, C. Padwick, W. J. Emery, and F. Pacifici, ÛÏUrban classification of a WorldView-2 multi-angle sequence,Û IEEE Transactions on Geoscience and Remote Sensing [submitted] [5] F. Pacifici, F. Del Frate, C. Solimini, W. J. Emery, ÛÏAn innovative neural-net method to detect temporal changes in high-resolution optical satellite imagery,Û IEEE Transactions on Geoscience and Remote Sensing, vol. 45, no. 9, pp. 2940-2952, September 2007.